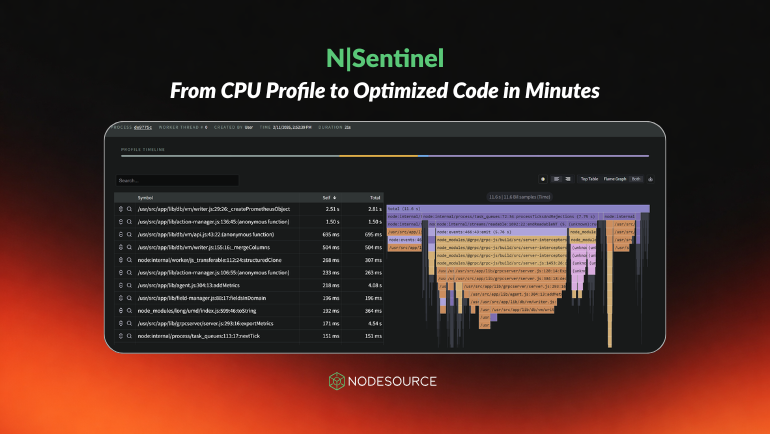
N|Sentinel automates profiling analysis and produces validated code optimizations within minutes. N|Sentinel generates CPU profiles from the dashboard or single process view, then vectorizes profile data into structured representations for AI reasoning. N|Sentinel identifies high self-time functions, deep V8 stacks, and nested call chains to detect critical bottlenecks. N|Sentinel proposes code changes, validates them against runtime behavior, and delivers actionable, tested optimizations. The workflow reduces manual flame-graph inspection, accelerates remediation under deadlines, and transforms runtime telemetry into executable performance improvements. Analysis begins with a single click via the AI icon in the CPU Profiles table or the individual profile view, enabling rapid end-to-end optimization.
"Production is slow. Where do you even start? You open the CPU profile. There are thousands of functions. Deep V8 stacks. Anonymous callbacks. High self-time functions. Nested call chains. You zoom in. You zoom out. You scroll through flame graphs. You try to guess what's actually killing performance. And deadlines don't wait. Now imagine this: What if your CPU profile could turn itself into optimized code - in minutes? That's exactly what N|Sentinel does."
"Beyond Observability: From Insight to Execution Traditional observability answers one question well: What is happening? Dashboards show CPU spikes. Metrics show event loop delay. Profiles show expensive functions. But they stop there. The real questions teams struggle with are: N|Sentinel was built to close that gap. It doesn't just analyze telemetry. It transforms runtime intelligence into actionable, validated optimization. How N|Sentinel Works Let's walk through the actual workflow."
Read at The NodeSource Blog - Node.js Tutorials, Guides, and Updates
Unable to calculate read time
Collection
[
|
...
]