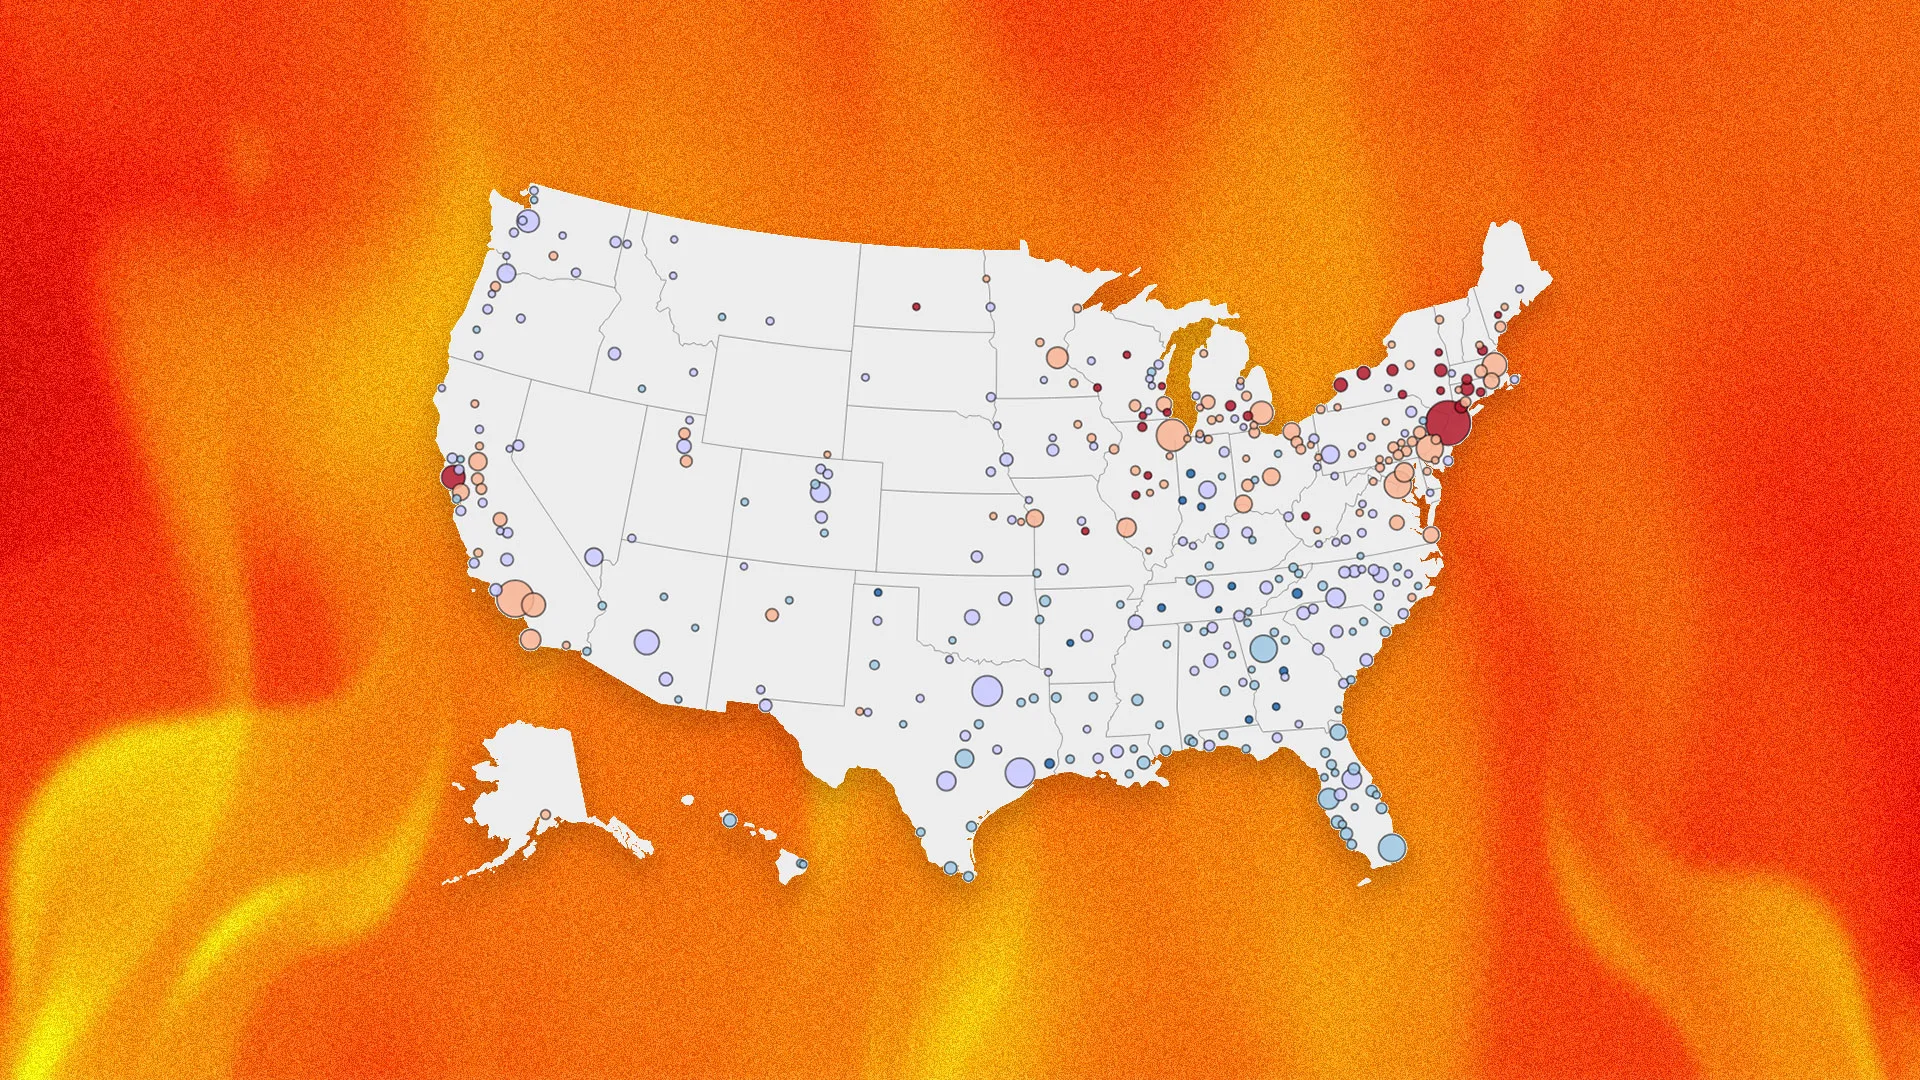
Zillow economists use the Zillow Market Heat Index to measure housing market competitiveness using home price changes, inventory levels, and days on market. The index produces a score where higher values favor sellers and lower values favor buyers, with thresholds defining strong sellers (70+), sellers (55–69), neutral (44–55), buyers (28–44), and strong buyers (≤27). Nationally the index read 52 in July 2025. Scores vary widely by metro: Rochester, NY scored 145 while Bridgeport, CT scored 72 among listed metros. Among the 250 largest metros, listed hottest markets include Jackson, TN (13) and Waco, TX (32).
"Zillow economists use an economic model known as the Zillow Market Heat Index to gauge the competitiveness of housing markets across the country. This model looks at key indicators-including home price changes, inventory levels, and days on market-to generate a score showing whether a market favors sellers or buyers. Higher scores point to hotter, seller-friendly metro housing markets. Lower scores signal cooler markets where buyers hold more negotiating power."
"That said, Zillow's reading varies significantly across the country. Rochester, NY → 145 Syracuse, NY → 91 Hartford, CT → 87 Buffalo, NY → 87 Charleston, WV → 86 Binghamton, NY → 80 Springfield, MA → 77 Albany, NY → 75 Poughkeepsie, NY → 75 Norwich, CT → 75 Springfield, IL → 75 Kingston, NY → 75 Lansing, MI → 73 Ann Arbor, MI → 73 Bridgeport, CT → 72"
Read at Fast Company
Unable to calculate read time
Collection
[
|
...
]