#agile
#agile
[ follow ]
#project-management #scrum #software-development #devops #productivity #sprint-planning #innovation #team-dynamics


fromMountaingoatsoftware
1 month agoEstimating and Planning in Agile: Why They Still Matter in 2026
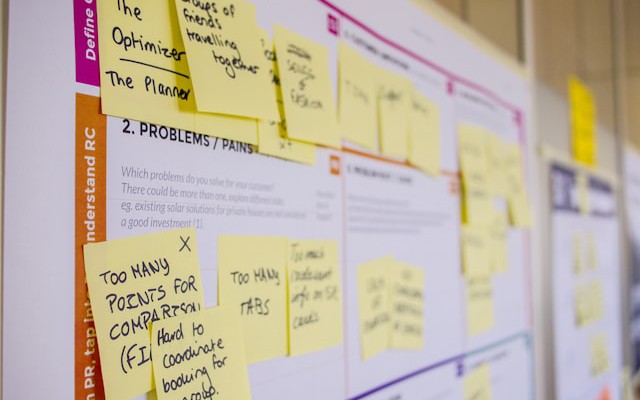
I hear the same stories again and again. Estimates treated as promises. Plans turned into contracts. Teams punished for being wrong rather than rewarded for learning. Given experiences like those, it's understandable that many teams conclude the solution is to eliminate estimating and planning altogether. I think that's a mistake. Estimating and planning still matter-not because the future is predictable, but because it isn't. They matter because teams and organizations still have to make decisions about what to work on
Software development
fromdzone.com
1 month agoAgile Manifesto: The Reformation That Became the Church
In 1517, Martin Luther nailed his 95 theses to a church door to protest the sale of salvation. The Catholic Church had turned faith into a transaction: Pay for indulgences, reduce your time in purgatory. Luther's message was plain: You could be saved through faith alone, you didn't need the church to interpret scripture for you, and every believer could approach God directly.
Philosophy


fromdzone.com
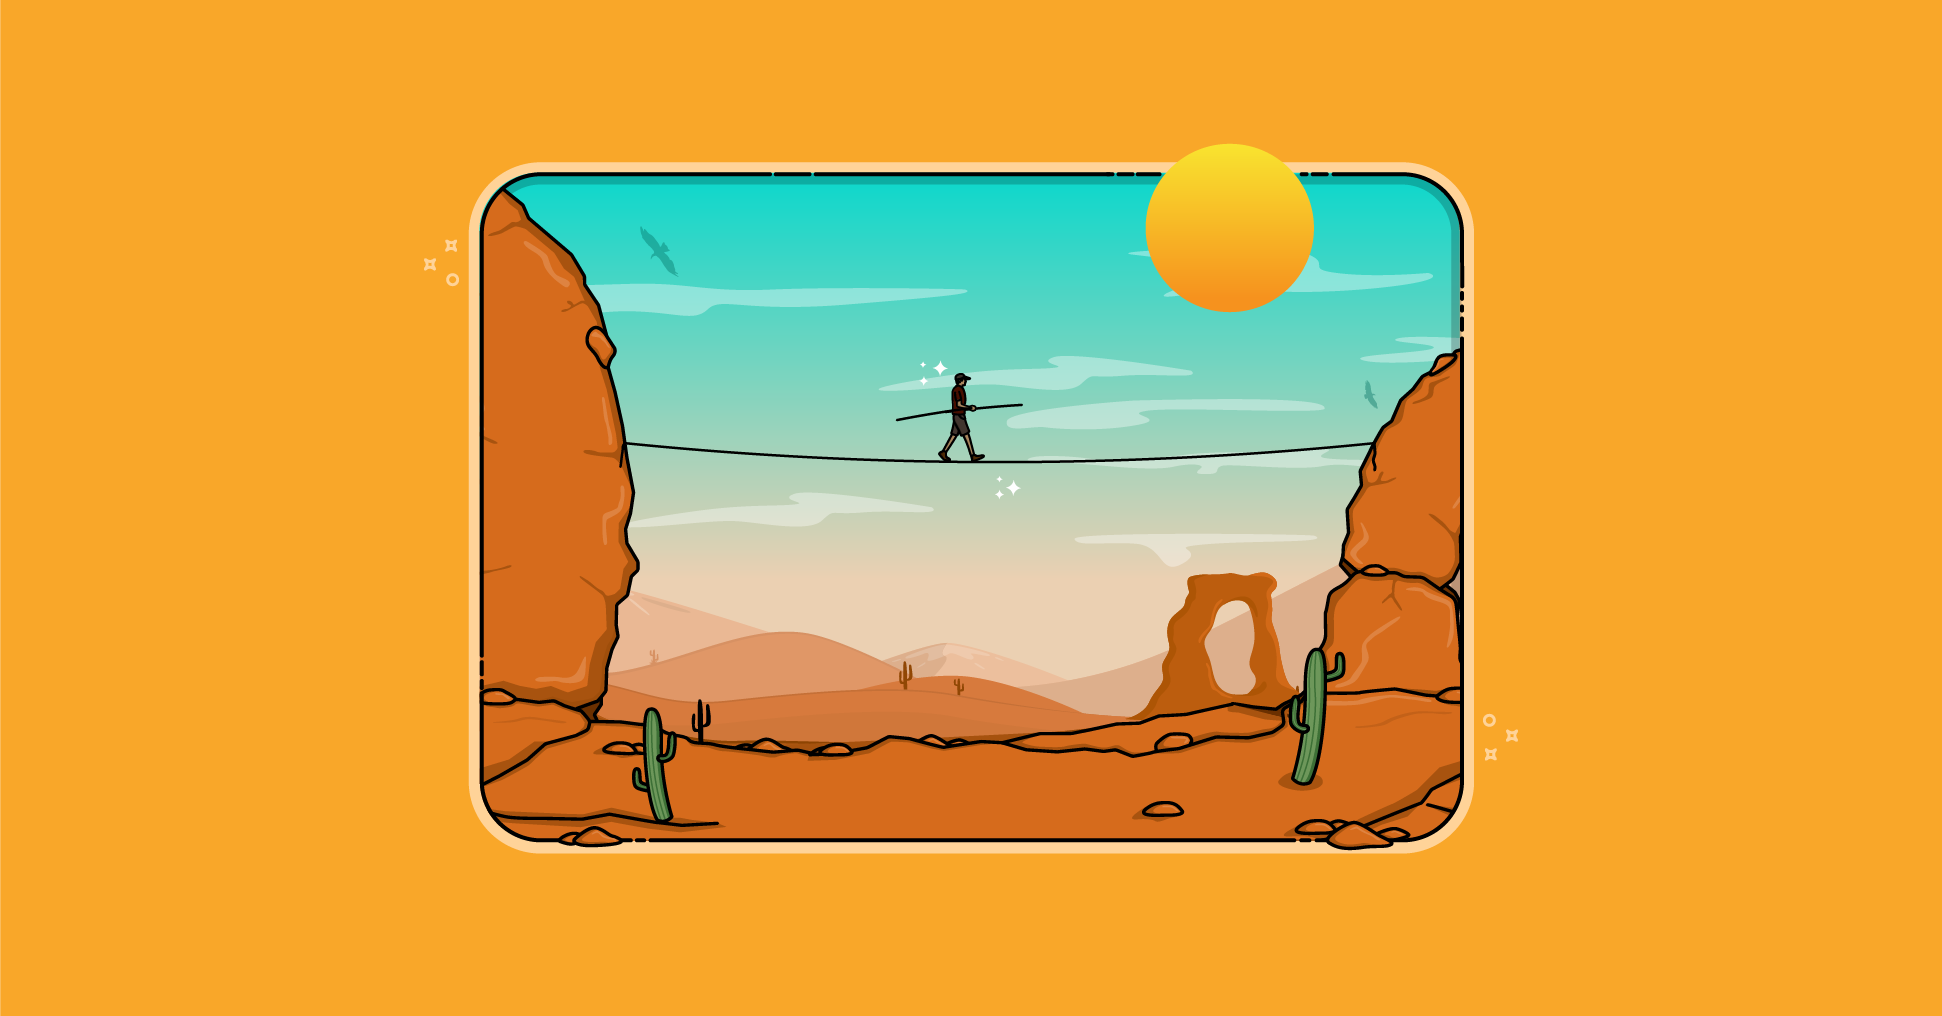
1 month agoAgile Is Dead, Long Live Agility
Let's trace Agile's trajectory: From 2001 to roughly 2010, Agile was a practitioner movement. Seventeen people wrote a one-page manifesto with four values and twelve principles. The ideas spread through communities of practice, conference hallways, and teams that tried things and shared what worked. The word meant something specific: adaptive, collaborative problem-solving over rigid planning and process compliance. Then came corporate capture.
Software development


fromForbes Advisor
3 years agoHow To Create A Simple, Effective Gantt Chart In Excel
A Gantt chart is a project management tool that helps you visualize timelines for your project at a glance. It lists the project tasks that need to be completed down the left column and dates across the top row. A bar represents the duration of each task, so you can see at once when each task will begin and end. The visual makes it easy to plan a project and set realistic delivery dates because you can assign realistic start and finish dates for tasks that are contingent on the completion of other tasks.
Productivity
fromeLearning Industry
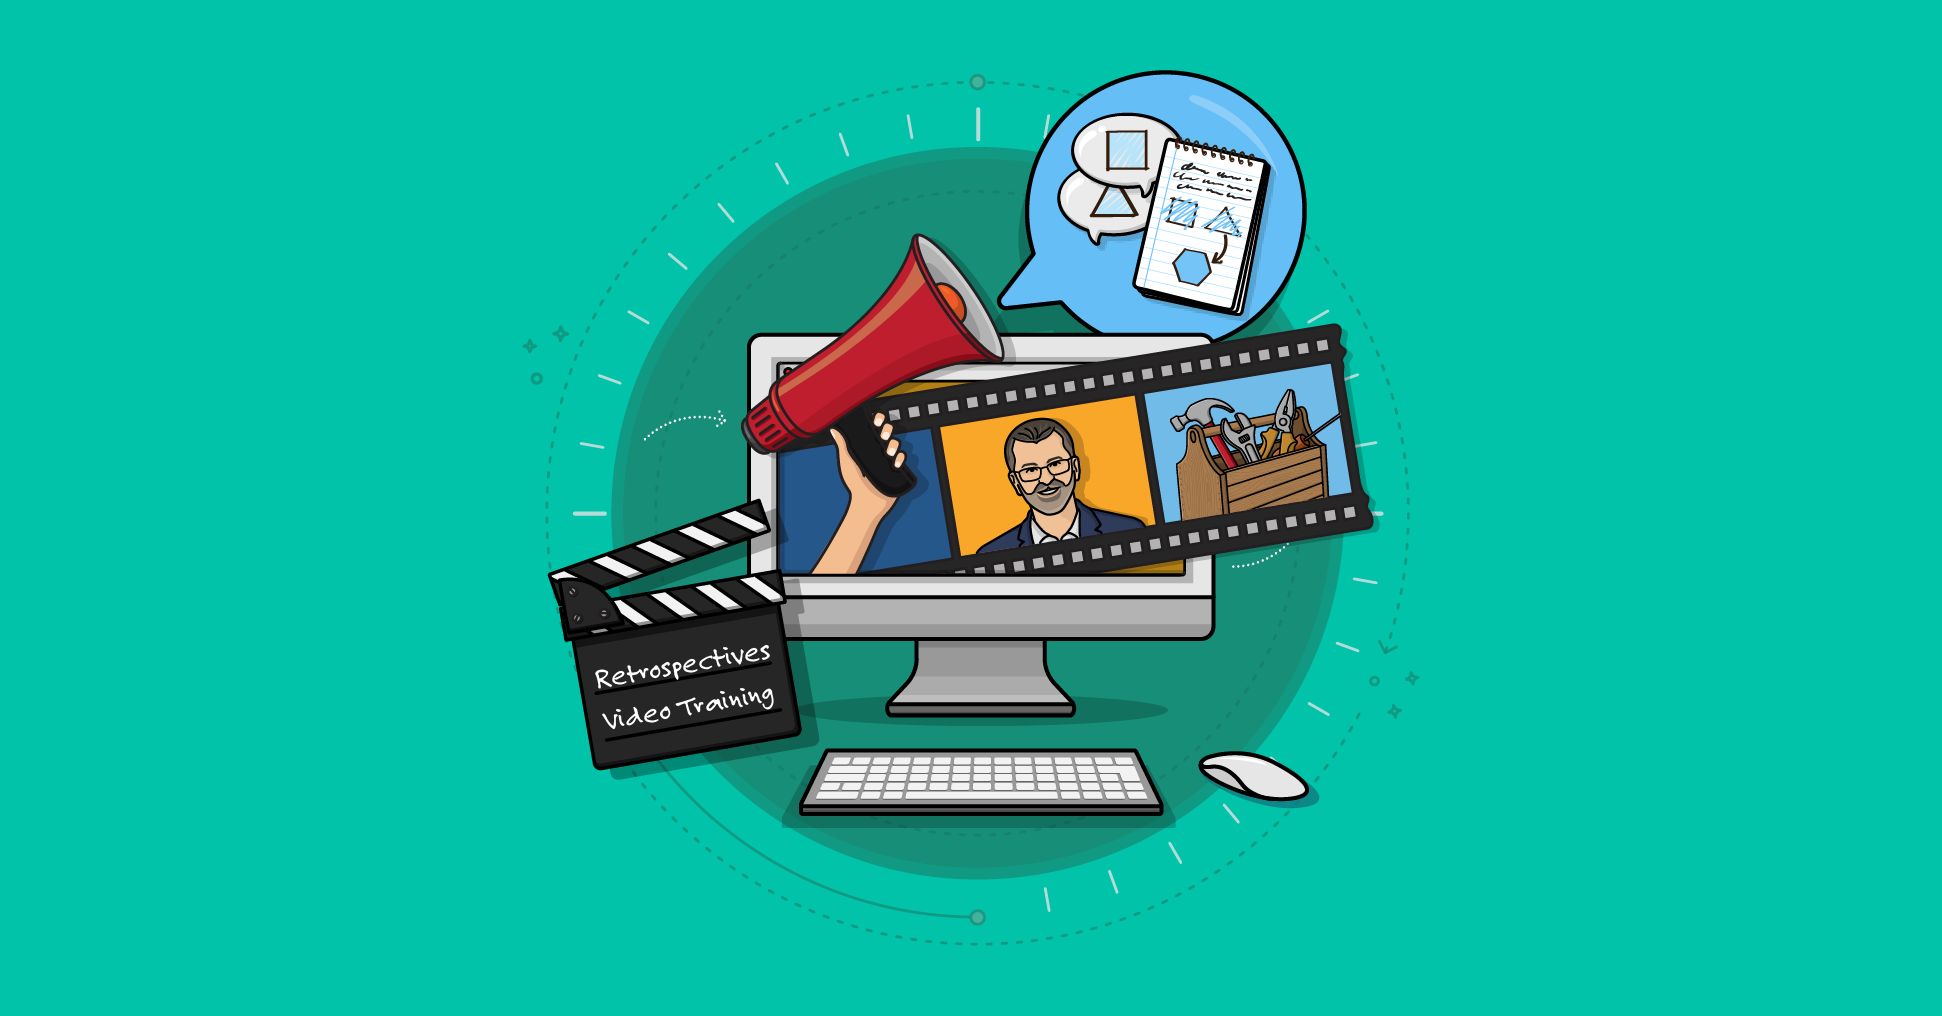
4 months agoBest Project Management In eLearning Development 2026
If you've ever been involved in eLearning development, you know that great ideas are only half the battle; the other half is project management. The truth is, even the most creative Instructional Design can fall apart without the right structure, tools, and communication in place. That's why every year we take a closer look at the companies that aren't just building courses, but mastering the art of keeping projects on track, teams aligned, and clients happy.
Online learning
fromMountain Goat Software
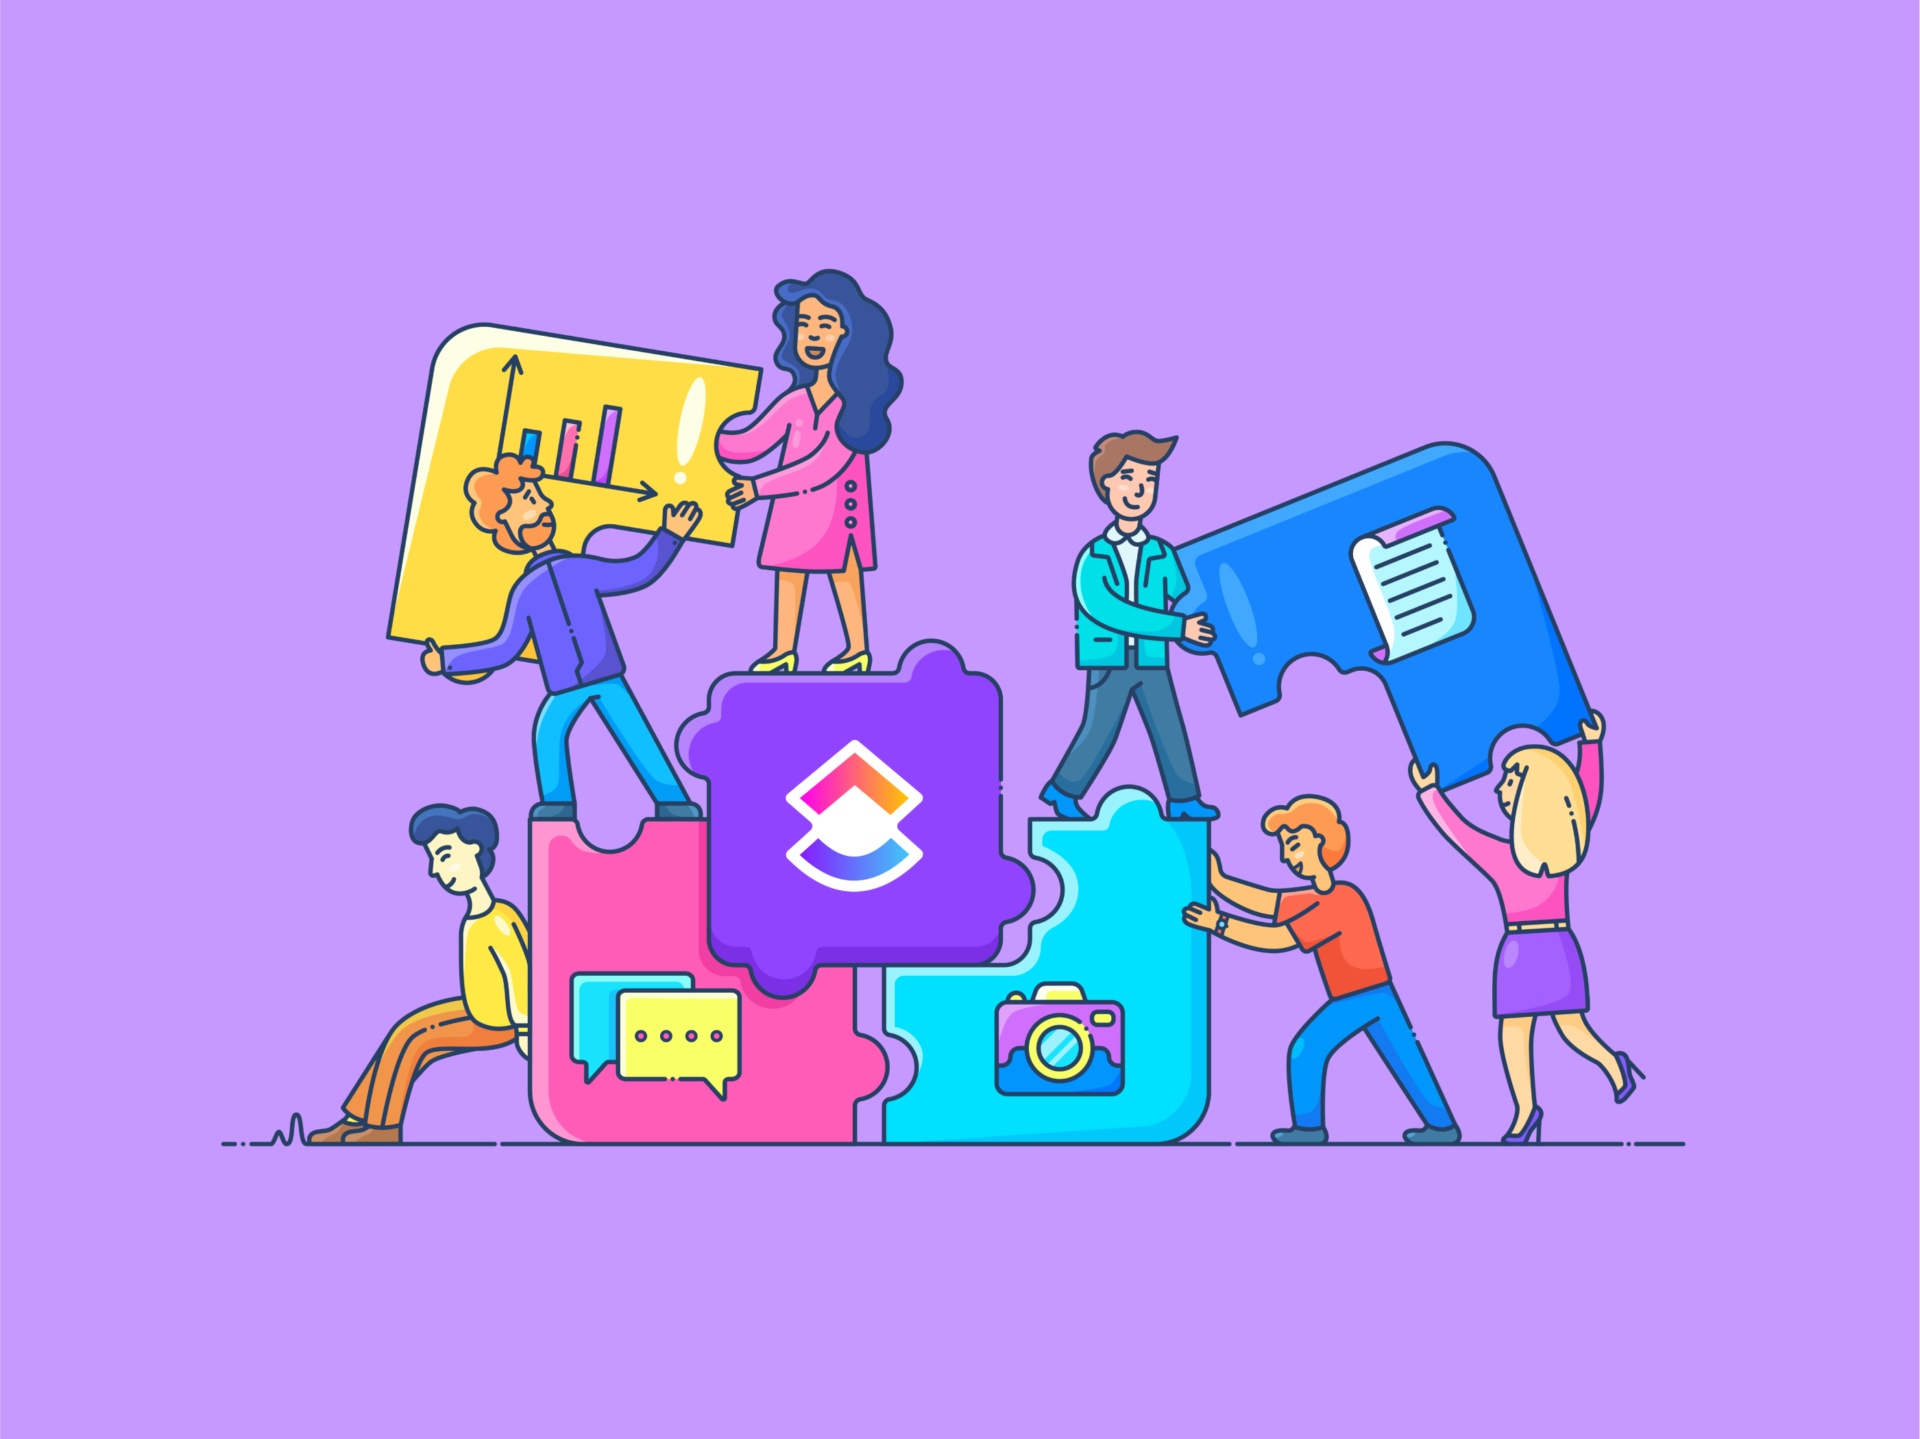
5 months agoAgile Is Both Iterative and Incremental
What Is Iterative Development? An iterative process makes progress through refinement. An iterative approach to work starts with a rough version of a feature or product, then improves it through repeated cycles-each one getting closer to the final form. For example, a sculptor who approaches work iteratively might begin by roughly carving a block of stone. With each pass, they would refine the form-adding details, smoothing edges, and continuously improving until the sculpture reaches its final shape.
Software development


fromdzone.com
9 months agoDomain-Centric Agile Modeling for Legacy Insurance Systems
In many insurance transformation initiatives, every team begins by modeling the interface, which involves writing stories for forms, APIs, or dashboards. Legacy systems don't behave on the interface level, though. They act at the process level.
Agile
[ Load more ]