#new-relic

[ follow ]
#opentelemetry

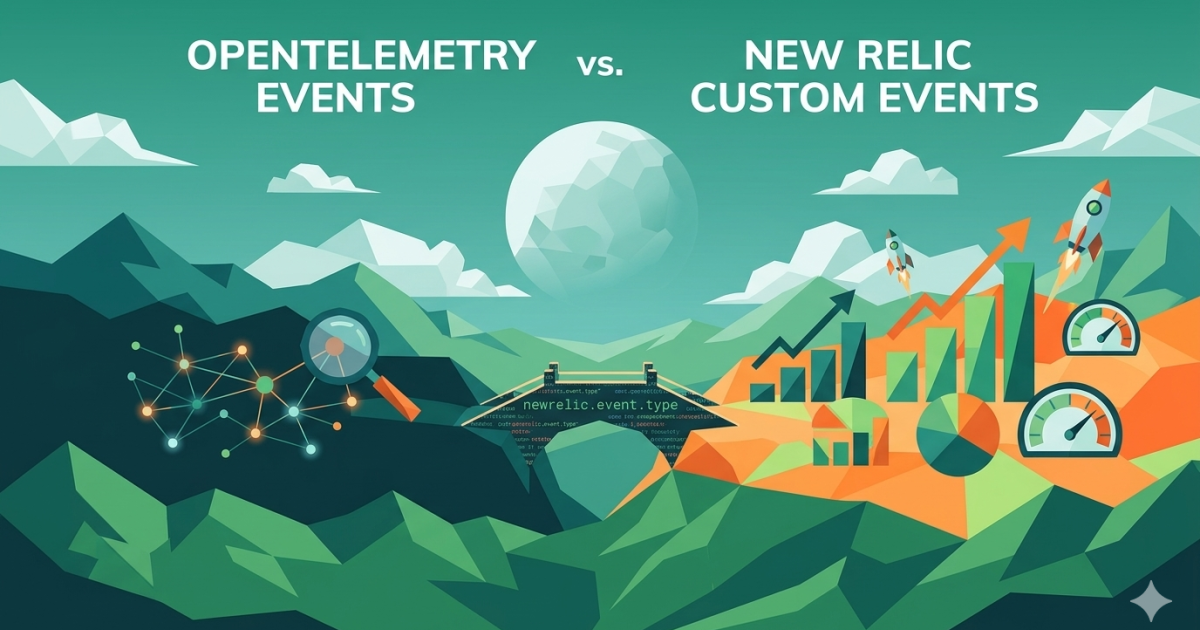
How to query OpenTelemetry data in New Relic

OpenTelemetry combined with New Relic enhances application monitoring and provides insights through standardized telemetry data collection.

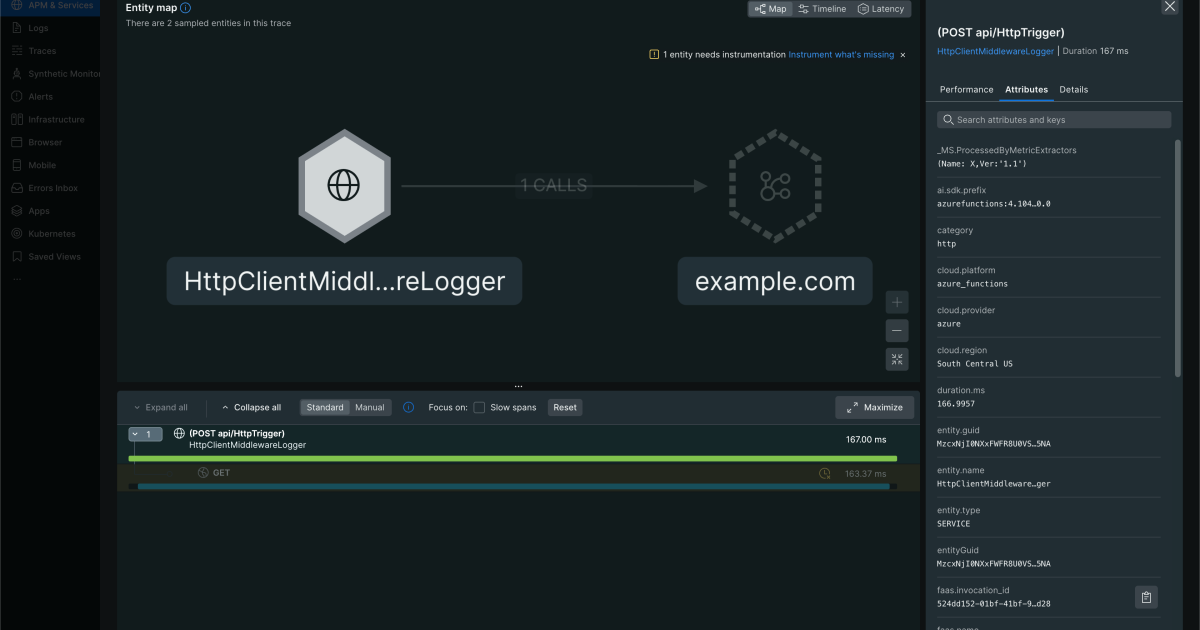
Running the OpenTelemetry community demo app in New Relic

New Relic's enhancements to the OpenTelemetry demo app allow for improved monitoring and troubleshooting via feature flags and configuration utilities.
moreopentelemetry

Achieve modern retail success across apps, stores, and fulfillment centers

Retailers need to create seamless, personalized digital experiences to maintain customer engagement and brand loyalty.

New Relic achieves PCI DSS Level 1 certification

New Relic has achieved PCI DSS Level 1 certification, enhancing security for cardholder data environments and monitoring capabilities.
#observability

Enhancing web debugging using source maps with New Relic browser monitoring

Nonfunctional requirements (NFRs) are important indicators of good applications and vital to the success of a system.
Observability is one aspect of achieving nonfunctional requirements (NFRs) and helps with proactive troubleshooting and optimization of software systems.

What the ANZ Classic mobile app does to monitor its users in real time

Observability is crucial for effective technology rollouts at ANZ Bank.
ANZ Bank uses New Relic to track key metrics for optimal performance and to align with service standards.

Introducing one-step observability for Kubernetes to deliver automatic instrumentation and insights

New Relic launches one-step observability for Kubernetes, enhancing monitoring efficiency and developer productivity through automatic application performance monitoring integration.

Observability in a distributed world

The rise of distributed systems necessitates enhanced observability tools like New Relic to manage complexity and error tracking.

Data pipeline observability

Data observability is critical for accurate invoicing in consumption-based pricing models.

New Relic innovation at AWS re:Invent 2024

New Relic enhances its existing AWS integrations with innovative AI capabilities to improve operational insights and workflows.
moreobservability
#generative-ai

New Relic Relies on AI Agents to Launch Intelligent Observability Platform - DevOps.com

New Relic's AI-driven platform simplifies observability by enabling non-experts to gain insights, thereby democratizing its use across organizations.

New Relic AI monitoring is now generally available

New Relic introduces AI monitoring solution to empower organizations in leveraging advanced AI models for their applications.
moregenerative-ai
#troubleshooting

SAP business app support teams optimize process flows with New Relic

Inefficient manual troubleshooting in SAP can lead to business process interruptions that hurt financial performance.
New Relic enables improved monitoring and faster resolution of SAP issues, enhancing the overall business process efficiency.

How To Update Your Helm Chart Release's Values ONLY?

Always verify the installed version of Helm charts before upgrades to prevent mismatches.
Use helm upgrade to change specific settings without a full upgrade.
Thorough troubleshooting is key if errors occur during Helm upgrades.

How To Update Your Helm Chart Release's Values ONLY?

Ensure you know the currently installed Helm chart version to avoid mismatches during upgrades.
Use the helm upgrade command to modify specific settings without disrupting your entire configuration.
Be prepared to troubleshoot errors during Helm upgrades if issues arise.
moretroubleshooting

Manage your metric cardinality with ease

Cardinality limits enhance performance and manage data volume effectively.

How to monitor Oracle ExaCC databases using New Relic

Oracle's move to multitenant databases enhances management and monitoring capabilities for both application teams and database administrators.
#performance-monitoring

How Statista cut latency by 95% with New Relic's free tier

Implementing New Relic's free tier can help validate and measure infrastructure and application performance.
New Relic's easy implementation and cost-efficient pricing can make a strong case for expanding its observability deployment.

Optimizing AI chatbot performance with New Relic AI monitoring

Chatbots are essential in business for providing real-time assistance and automating customer service.
Using tools like New Relic AI monitoring ensures optimal chatbot performance and user satisfaction.
moreperformance-monitoring
#integration

Unraveling the Kubernetes myth: The story behind the plushy

The Kubernetes logo symbolizes navigation through containerized applications.
New Relic offers seamless integration with Kubernetes for monitoring and optimization.

Enhance your internet observability with Amazon CloudWatch Internet Monitor integration with New Relic

The integration enhances application performance monitoring, simplifying complexities and improving user experience.
moreintegration

Taming the change chaos: Why change tracking matters in software

New Relic's change tracking and deployment strategies help developers manage and mitigate risks effectively.
#user-experience

Sensing Clues uses alerts and dashboards to easily monitor their tech stack

Setting up alerts in New Relic is a small but impactful step that can greatly improve monitoring and response time.
Dashboards provide an overview of infrastructure performance and user experience, helping to identify issues and make improvements.

How Halodoc monitors Core Web Vitals with New Relic

User experience is crucial for website success, Core Web Vitals are vital metrics for performance monitoring, New Relic simplifies Core Web Vitals tracking.

Guiding the clickstream: Browser user flow exploration and oversight

User flows are essential for understanding customer interactions and improving business performance.
moreuser-experience

New Relic named a Leader in 2024 Gartner Magic Quadrant for Observability Platforms for 12th Consecutive Time

New Relic is recognized as a leader in the 2024 Gartner Magic Quadrant for Observability Platforms, emphasizing their commitment to innovation and client success.

How to track test related events

Using New Relic's event API to collect and utilize test data for improving test coverage and execution time.

New Relic Release April 2024 Java Report

New Relic's report on the Java ecosystem provides insights from actual production data, revealing trends like Java 8 decline and rapid adoption of newer versions.
#devops

New Relic Adds Ability to Correlate IT Events to Business Processes - DevOps.com

New Relic Pathpoint adds a dashboard to collect business metrics alongside telemetry data.
The platform helps align the management of applications, services, and infrastructure by business function.

New Relic launches Secure Developer Alliance

New Relic introduces Secure Developer Alliance for observable application security, aiming to provide best-of-platform tools and guidance.
moredevops
#docker

Guide: How to route Docker logs correctly in New Relic

Understanding the importance of proper container log management is crucial in the Docker and New Relic community.
New Relic infrastructure agent may lead to logs being aggregated together in the Host UI rather than categorizing them appropriately in the Container UI.

Dockerize Play2 Web API with New Relic Integration

Smooth deployment and robust monitoring are important for delivering applications.
Docker and New Relic can help simplify deployment and provide insights into application performance.
moredocker

Driving DevOps productivity with New Relic observability solutions

The key factors of DevOps productivity include code quality, CI/CD pipelines, and infrastructure performance.
New Relic provides tools and best practices to help developers and DevOps engineers increase productivity through a shift-left mindset.

New Relic Named Cloud Observability Leader in GigaOm 2024

New Relic named a Leader in GigaOm Radar for Cloud Observability for the third consecutive year.
New Relic showcases non-stop innovation with 80+ enhancements and unique usage-based pricing model.

New Relic IAST exceeds OWASP benchmarks with 100+ percent score

The OWASP Benchmark is crucial for measuring the effectiveness of security tools.
New Relic's IAST solution exceeded industry standards by scoring over 100% in the OWASP assessment.

New Relic Streamlines Observability Data Management - DevOps.com

New Relic introduces live archives for historical logs, reducing the need for data movement and reindexing.
Integration with Sentry Software allows for cost reduction and additional sustainability metrics collection.

Streamlining Monitoring: Introducing New Relic EKS Add-on Integration on EKS Marketplace

Amazon EKS simplifies containerized app development and deployment by leveraging Kubernetes.
New Relic observability add-on now available on EKS Marketplace for easy installation.

Unleashing the Power of Threat Modeling: Tools and Techniques for Secure Application Development

Manual threat modeling techniques involve using data flow diagrams and threat enumeration to identify potential vulnerabilities.
Automated threat modeling tools streamline the process and enhance accuracy and efficiency.

Measure the performance of your hybrid network with New Relic and AWS CloudWatch Network Monitor

Network monitoring is crucial for ensuring reliability and security.
New Relic has integrated with Amazon CloudWatch Network Monitor to troubleshoot connectivity issues in hybrid networks.

Streamline your streaming: Leveraging New Relic for AWS Elemental

AWS Elemental is a critical player in the streaming media industry, providing essential tools for media content delivery.
New Relic integration with AWS Elemental offers a comprehensive monitoring solution that goes beyond traditional methods.

2 monitoring priorities for The Water Project: Bug fixing and performance

New Relic's Errors Inbox centralizes and localizes errors, aiding in quickly identifying and resolving issues.

Seeking root cause and reducing noise with alert correlation

Alert correlation groups related alerts to reduce noise and enhance troubleshooting efficiency.

How to monitor AI applications built with NVIDIA NIM

NVIDIA and New Relic collaborate to streamline development, deployment, and monitoring of AI-powered enterprise applications.
[ Load more ]